Troubleshoot SOLIDWORKS add-in developed with SwEx framework
SwEx framework outputs the trace messages which simpifies the troubleshooting process. The messages are output to the default trace listener.
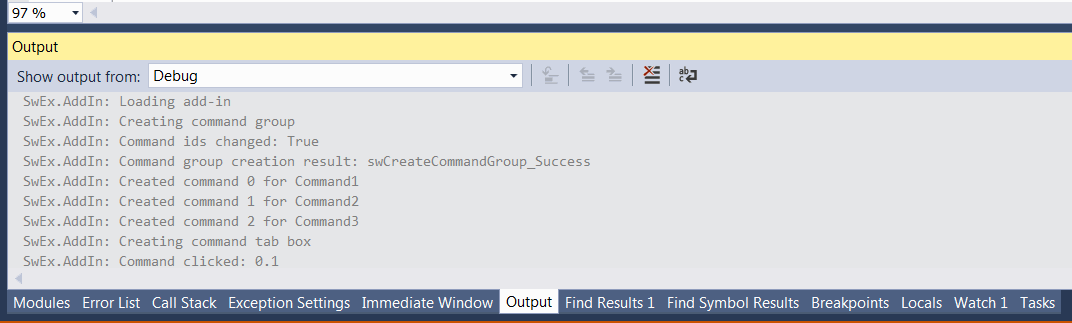
If add-in is debugged from Visual studio than the messages are output to Visual studio Output tab as shown below:
 { width=450 }
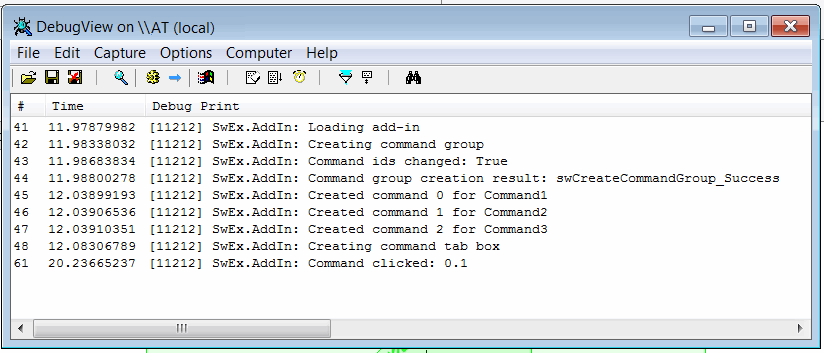
Otherwise messages can be traced via DebugView utility by Microsoft
- Download the utility from the link above
- Unzip the package and run Dbgview.exe
- Set the settings as marked below:
Enable Capture Win32 and Capture Events options from the toolbar (marked in red)
 { width=450 }
Alternatively set the capture options via menu as shown below:
 { width=350 }
Set the filter to filter SwEx messages by clicking the filter button (marked in green)
 { width=350 }
Messages will be output to trace window
 { width=450 }
Use eraser button to clean messages (marked in blue)
Notes
- Trace output is very powerful tool for troubleshooting the add-in on clients computers
- DebugView tool is lightweight and doesn't require installation and is provided by Microsoft
- Trace messages will be also output in the release mode
- SwEx framework will output the exception details if thrown while loading of the add-in which can help solving the problem when add-in cannot be loaded
Custom messages and exceptions can be logged from SwEx module. Follow this link for more information.